Mobile Commerce 2024: Key Trends, Statistics, and Outlook
Based on The Shopping App Insights Report by Adjust, let’s explore the latest data and key trends in mobile commerce for 2024.
We will examine what drives revenue growth in apps, how Gen Z is shaping the shopping ecosystem, and what innovations are being implemented in shopping apps.
- State and Development of E-Commerce and Shopping Apps
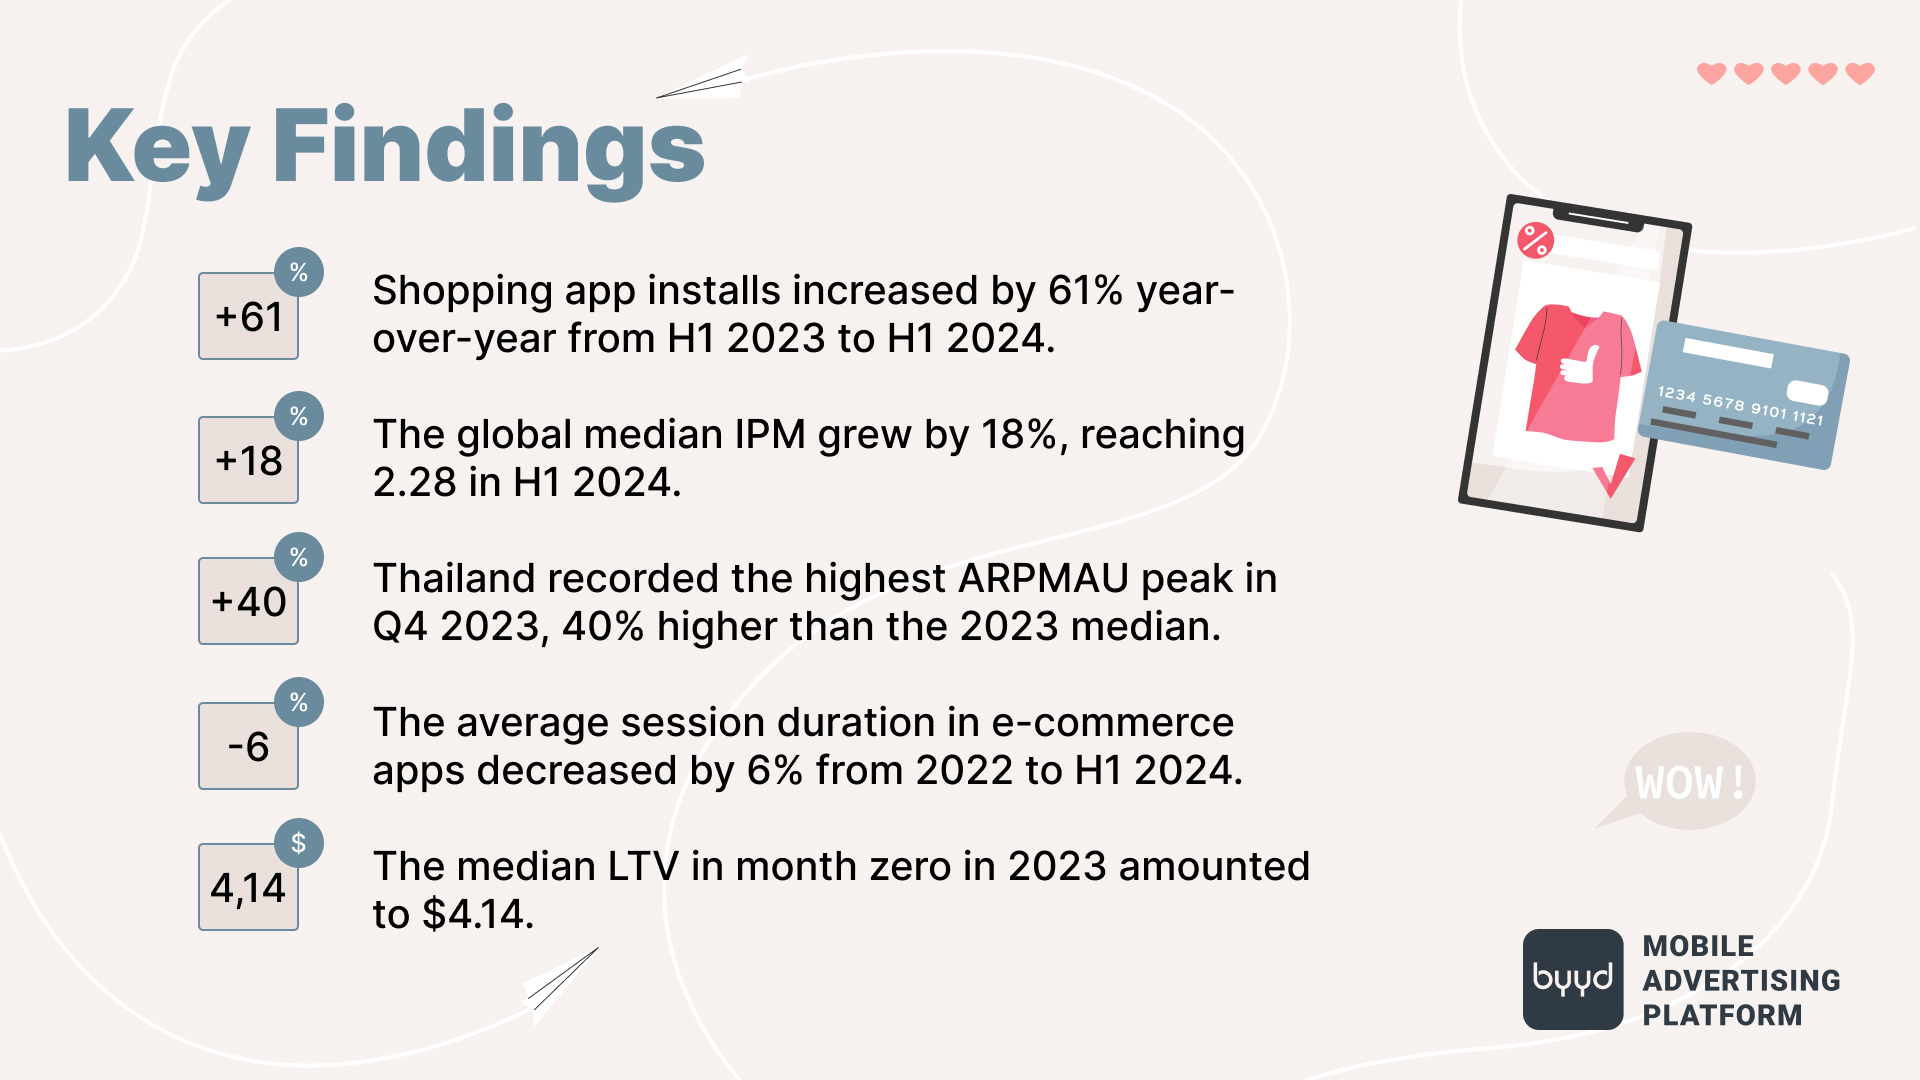
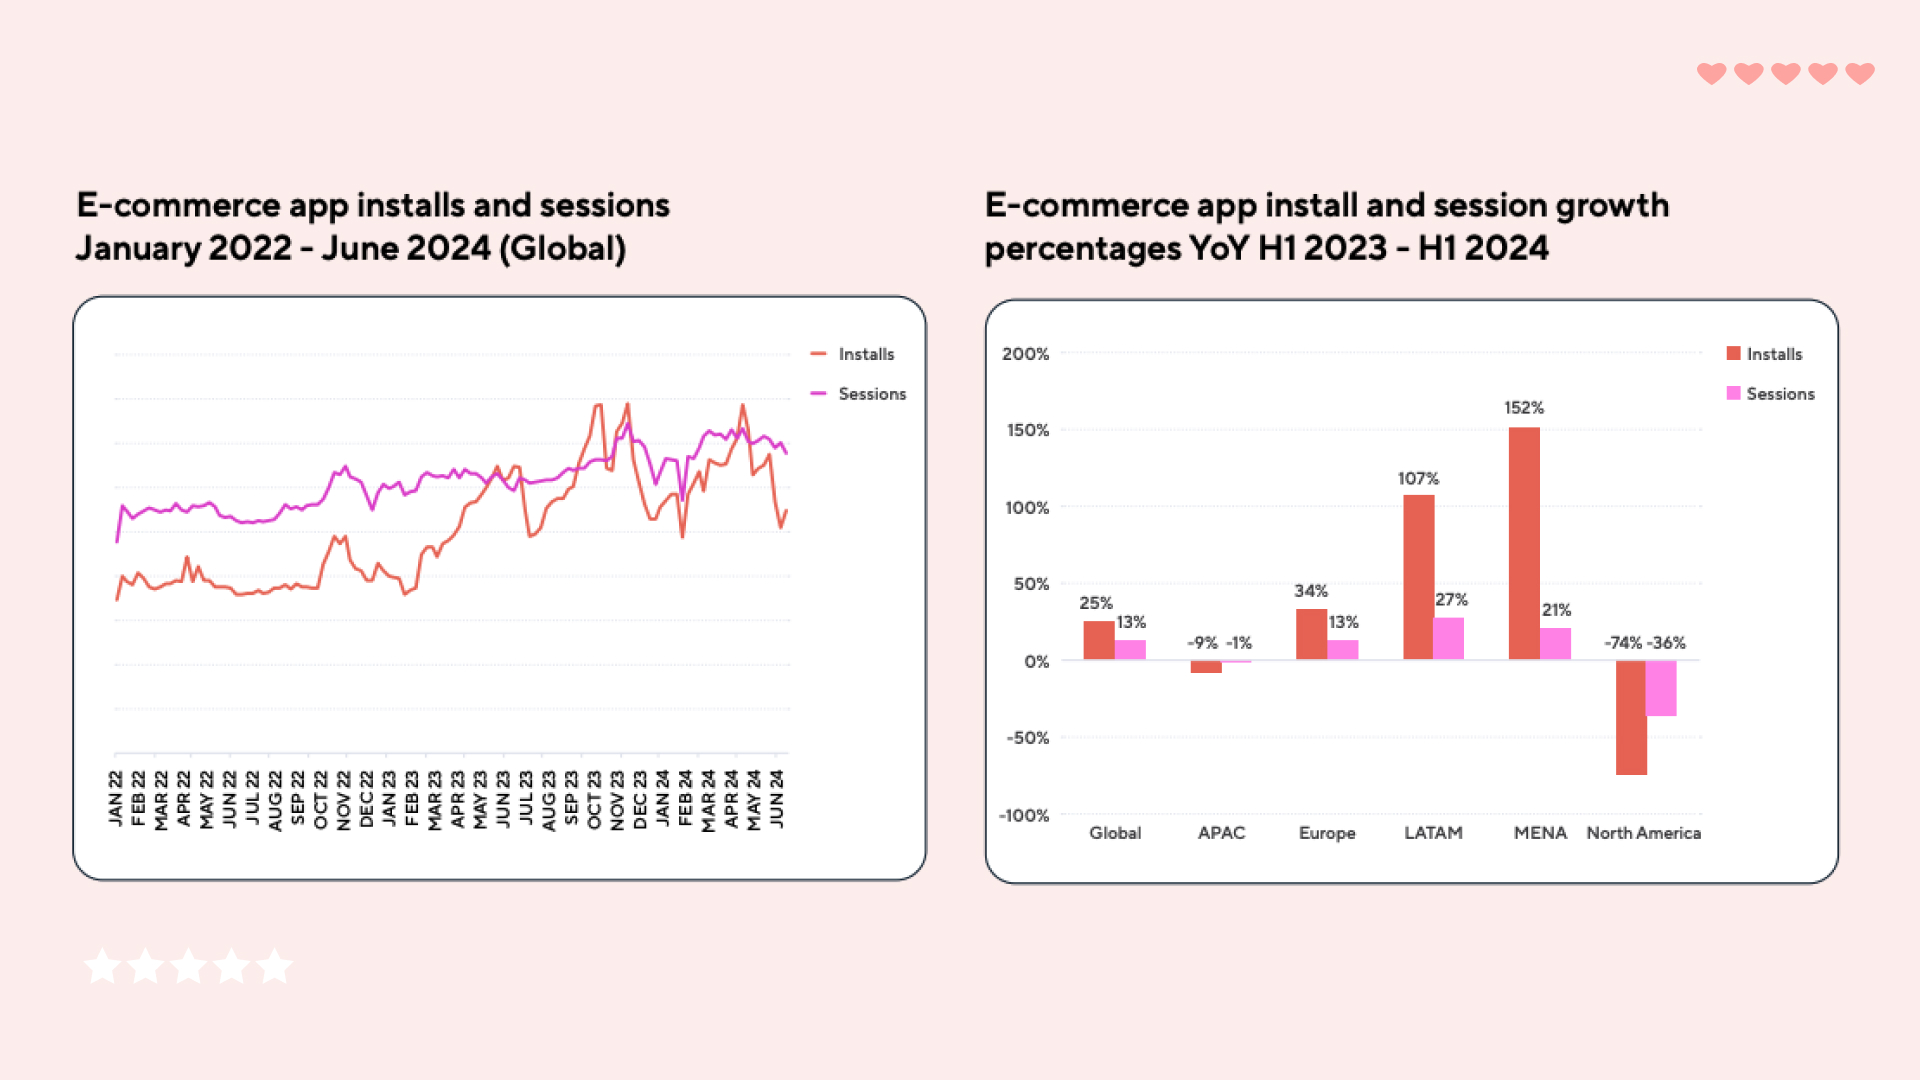
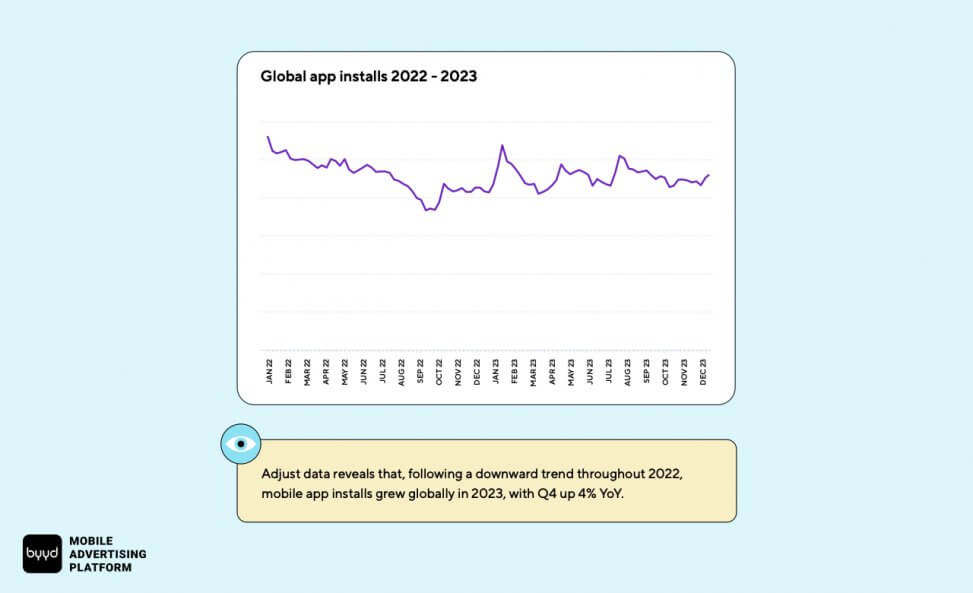
E-commerce app installs increased by 25% year-on-year during the first six months of 2024, with the number of sessions rising by 13%.
Shopping apps delivered even more impressive results, with installs growing by 61%. Holiday sales events, such as Black Friday and Singles’ Day, significantly contributed to this growth. For example, on October 17, installs were 40% higher than average, and on October 18, they were up by 41%.
The highest growth in installs was observed in Latin America and the MENAT region. In these regions, installs increased by 107% and 152%, respectively, while sessions grew by 27% and 21%.
In Q4 2023, Europe also demonstrated significant growth in installs, up by 164% year-on-year.
- Decrease in Session Duration in E-Commerce Apps
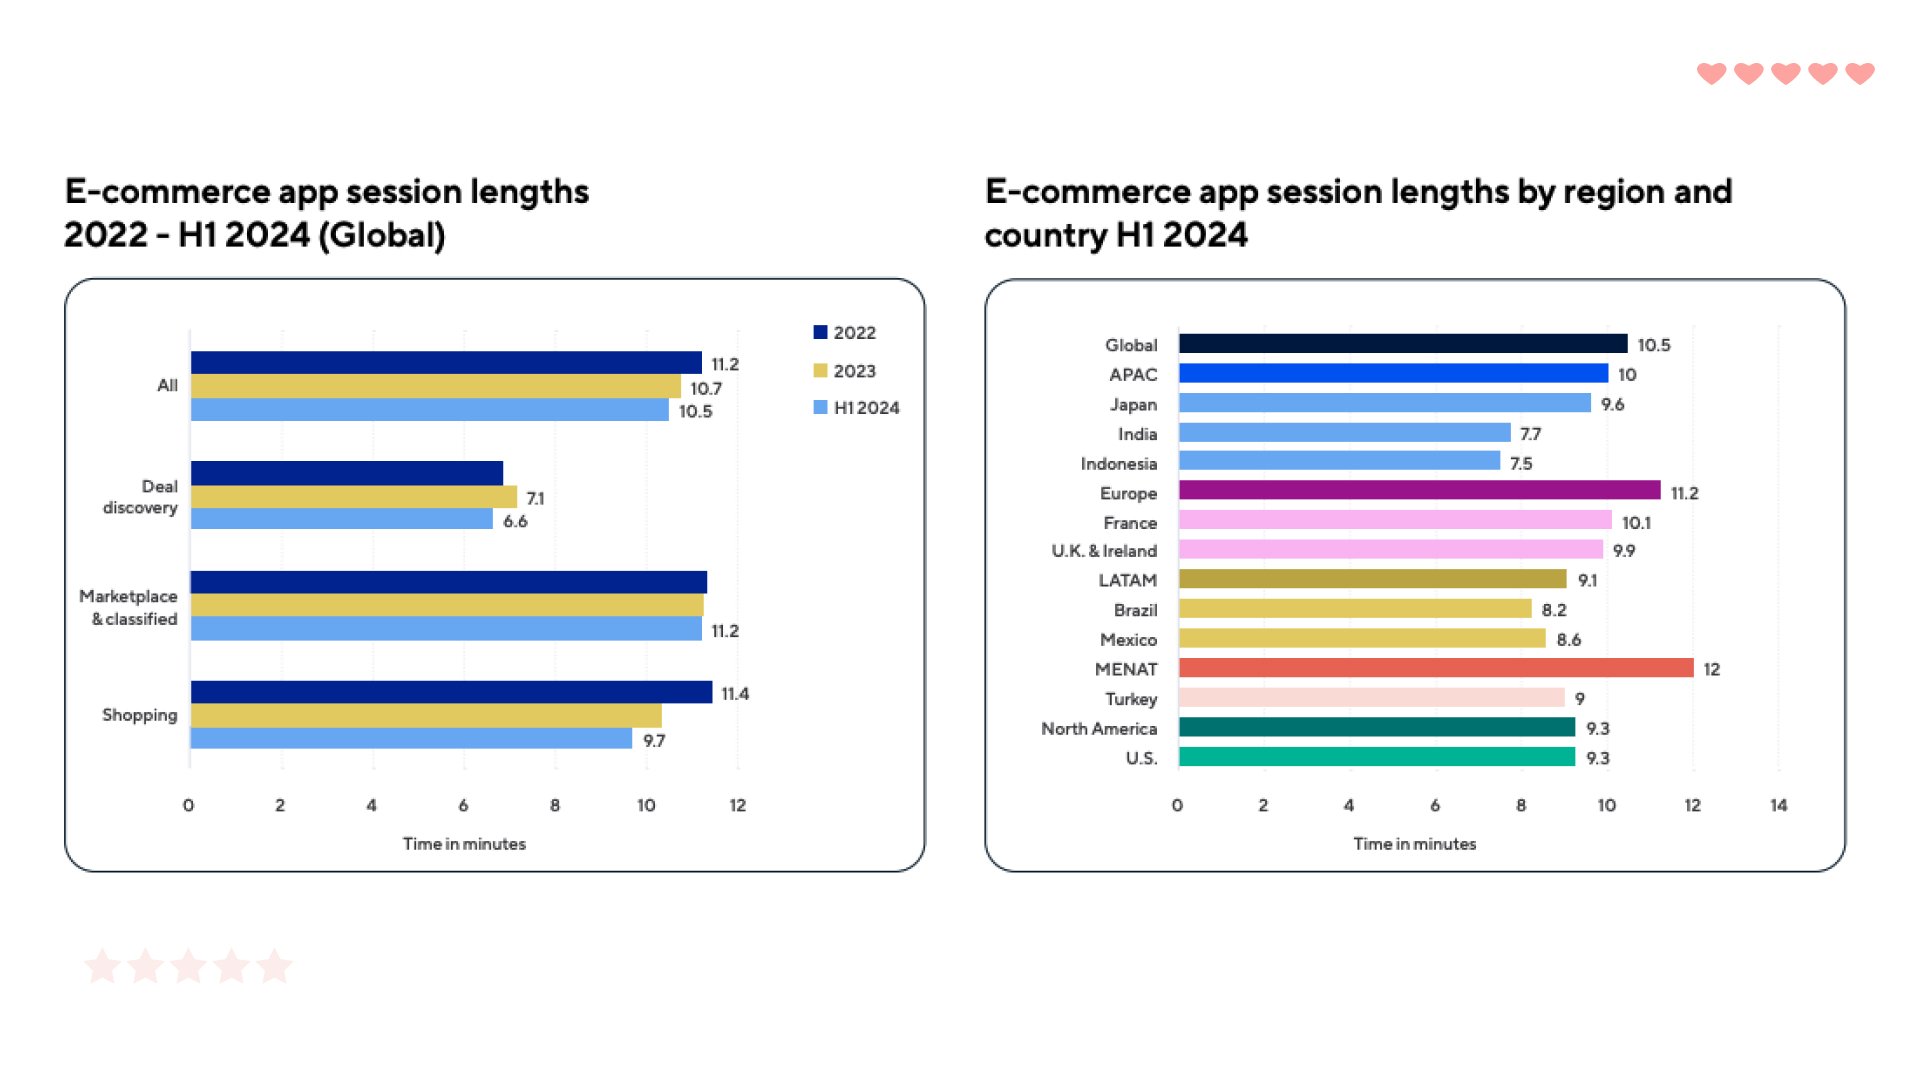
On a global scale, data indicates that the session duration in e-commerce applications decreased by 6% from 2022 to the first half of 2024. The average session time dropped from 11.2 minutes to 10.5 minutes.
It is noteworthy that shopping apps exhibited the most significant reduction, with an average session duration decrease of 15%. This decline in time spent in the app may indicate more efficient user journeys and process optimization.
Additionally, this also reflects the implementation of seamless payment options, which in turn enhances the overall user experience and increases the likelihood of purchase completions.
- User Session Growth in Shopping Apps and Marketplaces in 2024
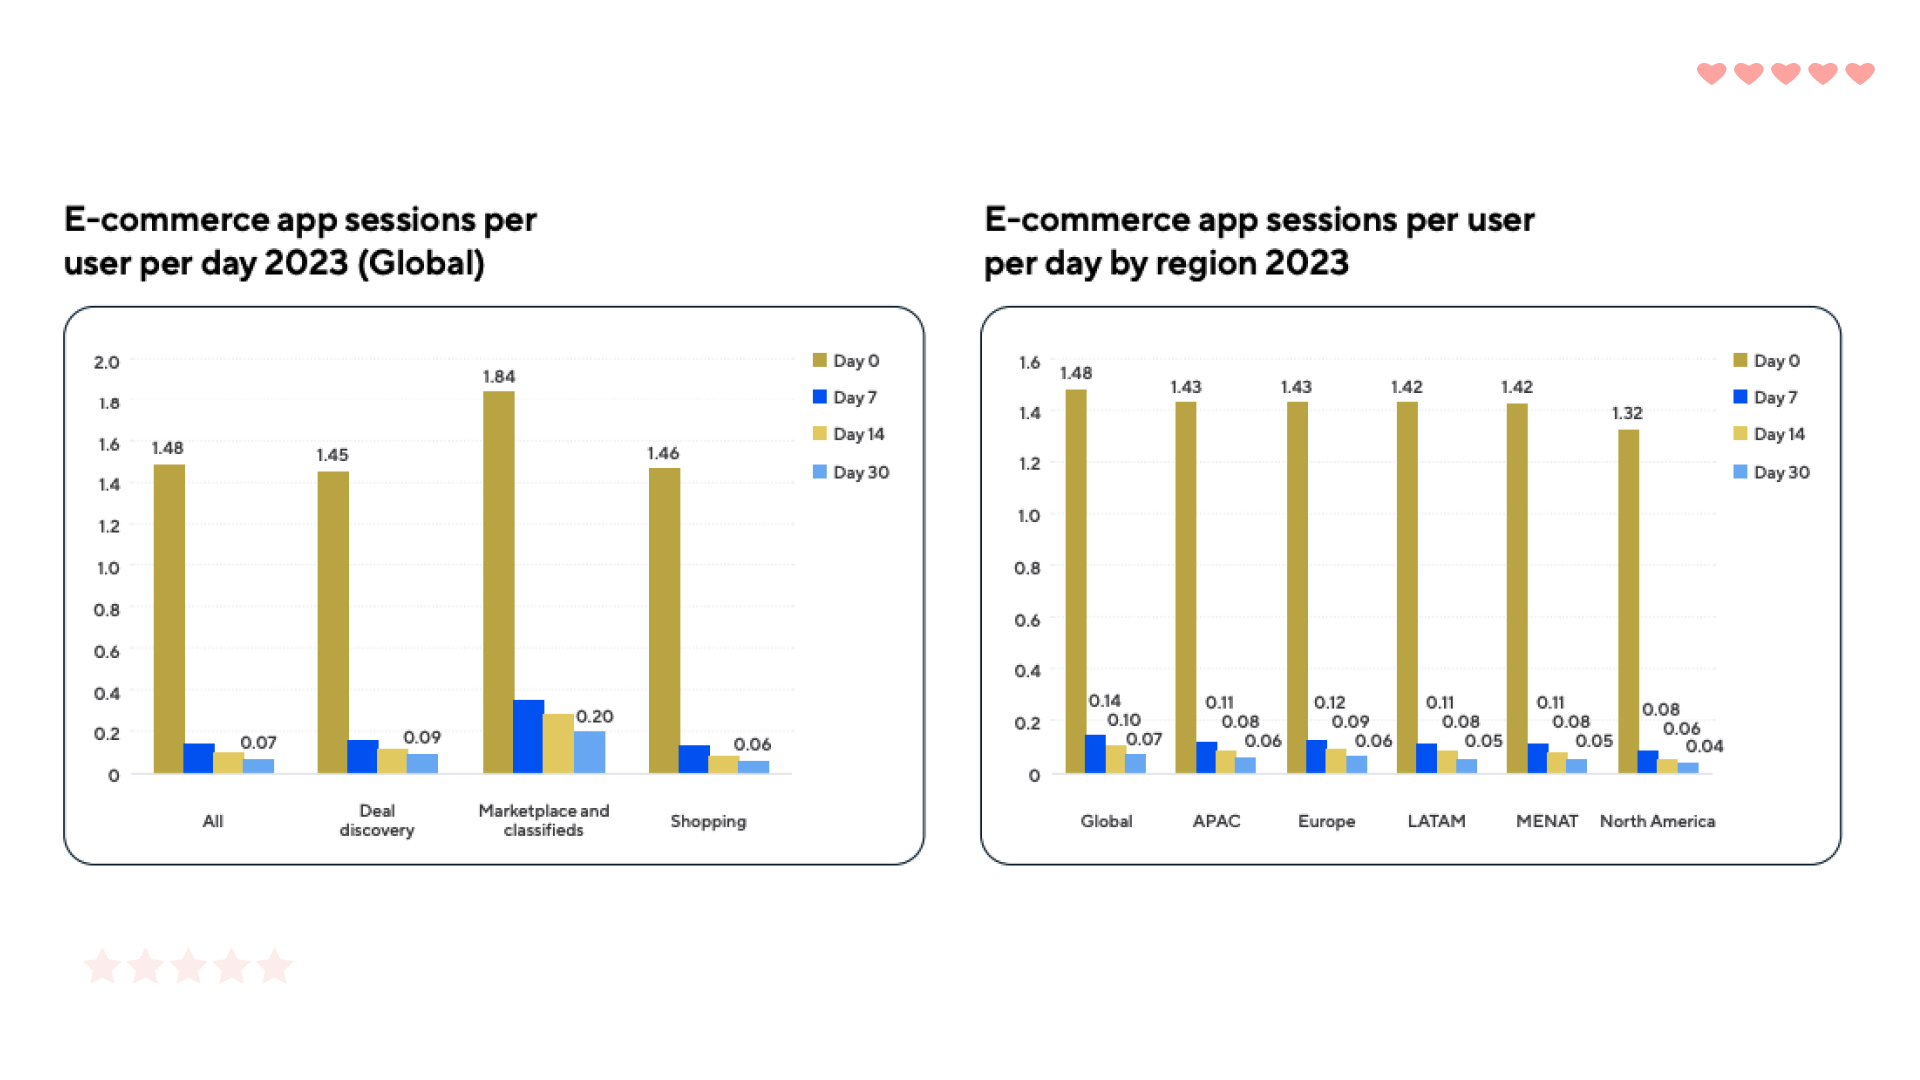
Shopping apps and deal-finding applications show similar results in terms of sessions per user on day 0 across the entire vertical.
In 2023, the global median for all applications was 1.48 sessions on day 0, while for shopping apps and deal-finding applications, it was 1.45 and 1.46, respectively.
Marketplace and classified apps demonstrated higher metrics, starting at 1.84 sessions on day 0 and decreasing to 0.2 sessions by day 30.
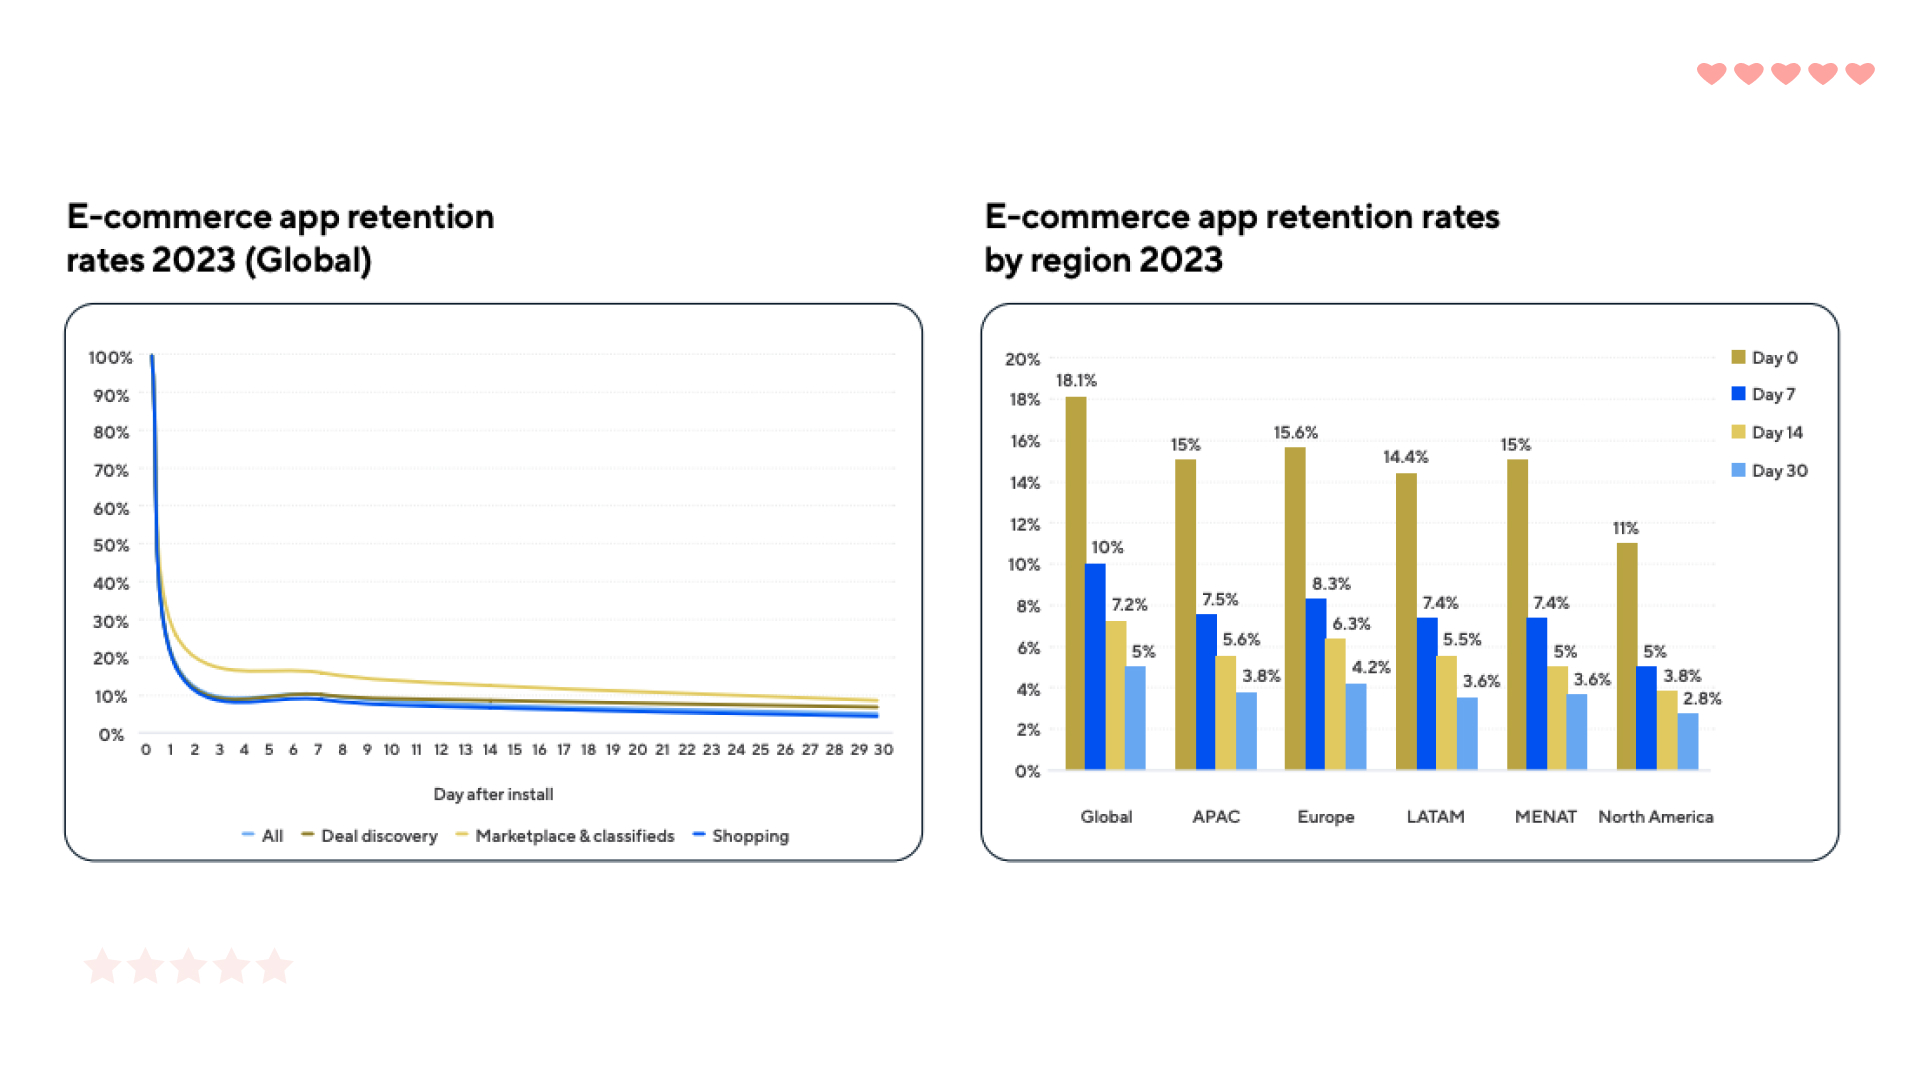
- User Retention Levels in E-Commerce Apps in 2023
In 2023, e-commerce applications exhibited a retention rate of 18% on day 1, which unfortunately dropped to 5% by day 30.
Deal discovery apps also started at 18%, but retained only 7% by day 30. Shopping apps showed an even steeper decline, starting at 17% on day 1 and dropping to 4% by day 30.
However, marketplace apps demonstrated better performance, beginning with a retention rate of 26% on day 1 and decreasing to 9% after 30 days.
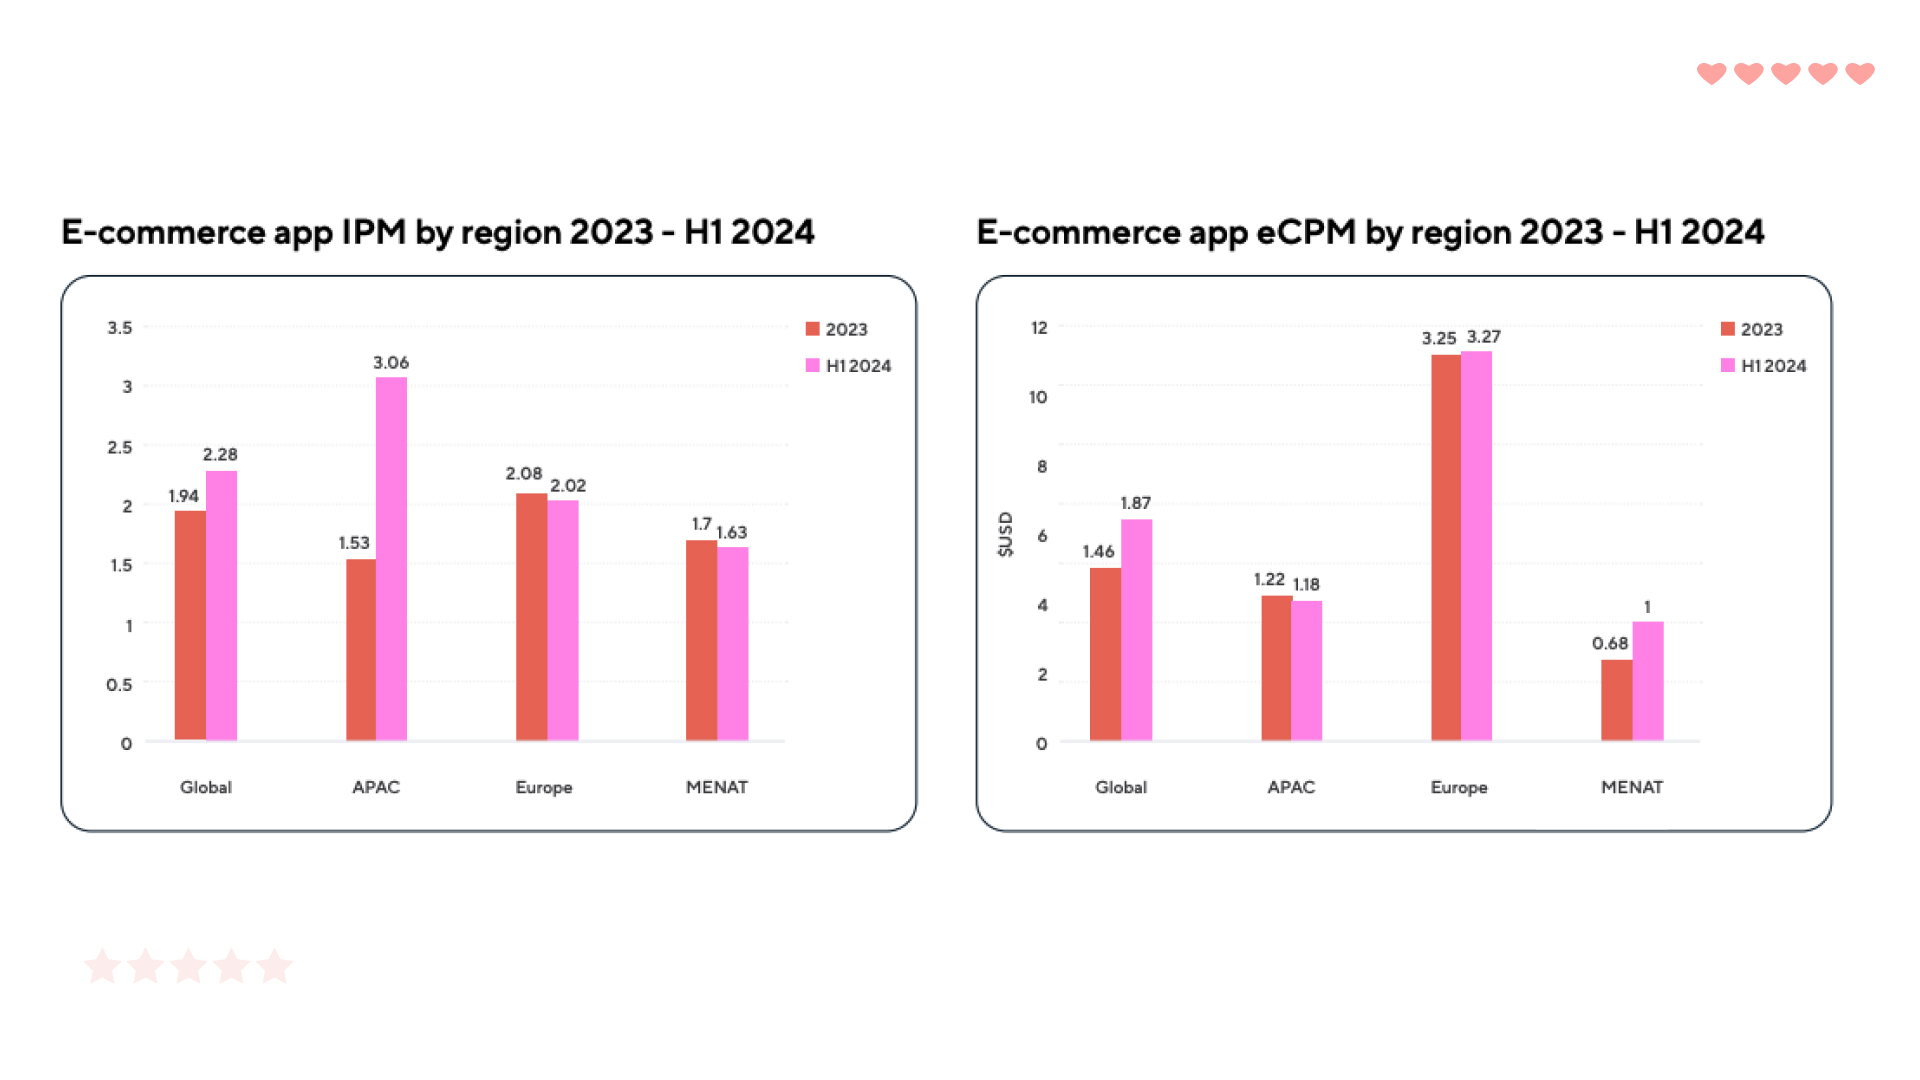
- Increase in Advertising Efficiency and Cost per Impression in 2024
The global median installs per thousand impressions (IPM) rose from 1.94 in 2023 to 2.28 in the first half of 2024. This indicates an improvement in the effectiveness of advertising campaigns.
It is noteworthy that the APAC region experienced a significant increase in IPM, rising from 1.53 to 3.06. Conversely, in Europe, IPM decreased from 2.08 to 2.02, likely due to a more challenging privacy and advertising environment.
The global median effective cost per thousand impressions (eCPM) increased from $1.46 in 2023 to $1.87 in early 2024.
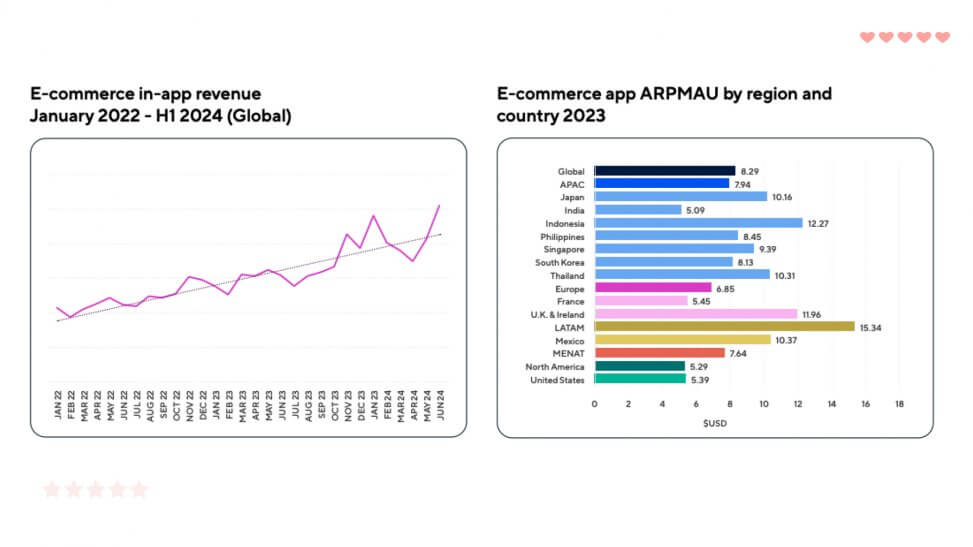
- Growth of Revenue in E-Commerce Apps in 2024
In the first halves of 2023 and 2024, revenue from e-commerce apps increased by 36% year-over-year.
The largest revenue spikes in 2023 were recorded in the fourth quarter: in November, revenues were 34% above the average monthly figure, while in December, they were 22% higher. Additionally, Adjust’s data revealed that 60% of in-app revenue came from Android devices.
The average revenue per active user per month for e-commerce apps was $8.29.
- Influence of Gen Z on the Shopping Ecosystem
The purchasing power of the younger generation continues to grow, transforming the shopping ecosystem.
Generation Z, for example, values social commerce (63%) and live shopping (57%) as key components of their shopping experience.
These trends are particularly evident in China, where Douyin (the Chinese version of TikTok) is projected to generate $198.8 billion in revenue in 2024 due to its innovative use of social commerce.
Such shopping experiences, which combine entertainment and retail, are revolutionizing consumer interactions with brands.
- Innovations in Shopping Apps
Shopping apps are actively developing new purchasing experiences by leveraging AI and AR technologies. For instance, virtual try-ons and at-home visualizations are becoming increasingly popular.
In the U.S., 49% of shoppers prefer AR try-ons over traditional options. This trend leads to higher engagement and a reduction in return rates.
Subscription models are also gaining popularity in the e-commerce sector, particularly in marketplaces inspired by examples like Amazon Prime.
Advice from BYYD
Mobile commerce apps are seeing high activity, but shoppers often arrive looking for a specific brand. This is why it’s crucial to familiarize users with your offerings before they reach the marketplace.
How can this be achieved? By using mobile advertising.
This tool helps enhance brand visibility and informs users about products or services, increasing trust and the likelihood of purchase.
Moreover, mobile advertising is an excellent way to convey urgent offers, such as promotions and sales.
Our platform has extensive experience in this area, and targeting plays a crucial role in the success of campaigns.
We provide access to Big Data, enabling the retrieval of unique anonymized data.
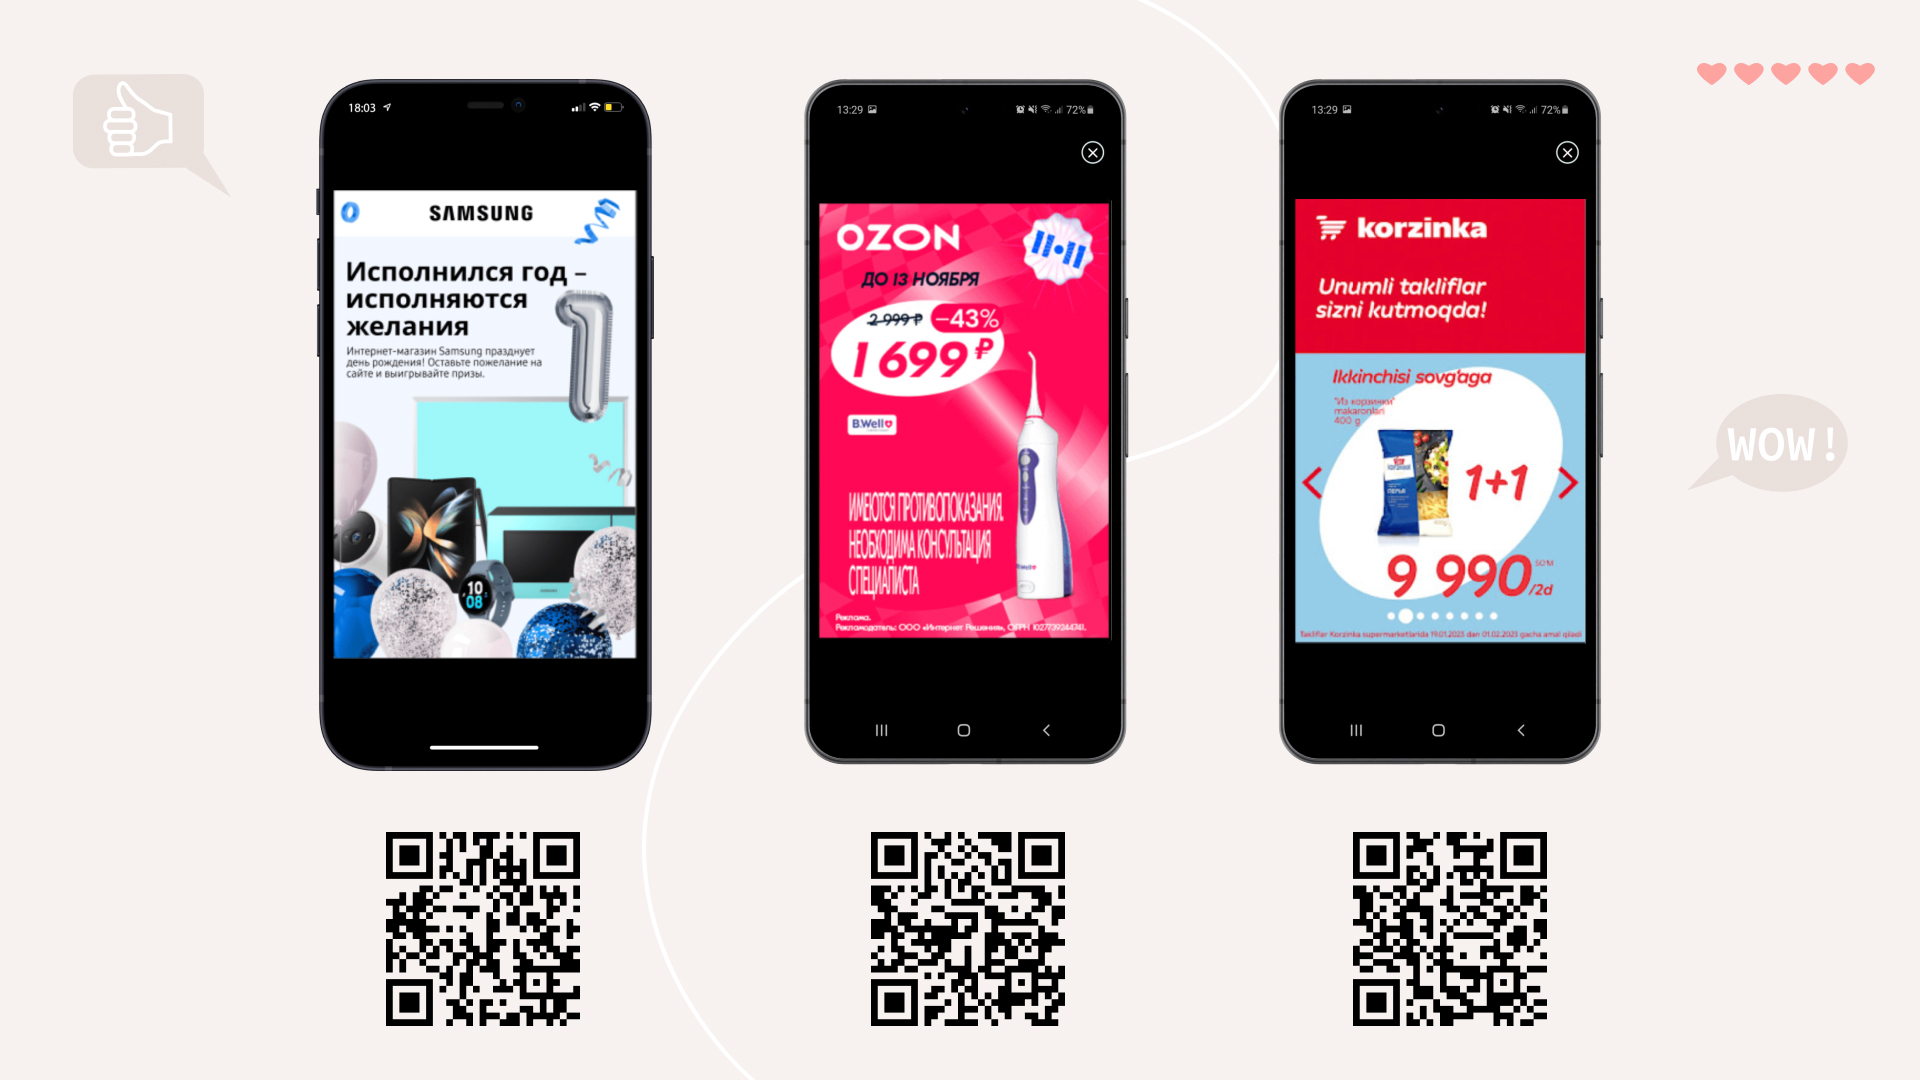
A prime example of the successful application of these methods is our case with the Ozon brand, where the goal was to inform customers about a sale. To achieve this, we displayed ads to users with popular marketplace apps installed.
As a result, through meticulous data analysis from BYYD and exports from the Ozon dashboard, we managed to reach over 3 million users and meet all the stated KPIs.
If you also want to launch in-app advertising, reach out to us.
Explore our case studies and connect with BYYD specialists to kickstart your campaign.
Found this helpful? Then share it with your friends and colleagues!
For consultations and partnership inquiries:
- Submit a request on our website.
- Email us at hello@byyd.me